The following are data product examples made from NESSI imaging
at WIYN for one target in one filter.
FITS reconstructed images & relative photometry + astrometry:
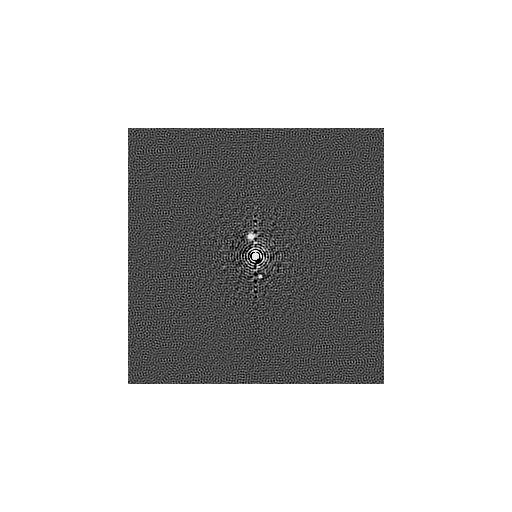
A reconstructed image, 4.6x4.6 arcsec in extent, with North at the
top and East to the left. This data product is produced by the
pipeline in each filter for each target in FITS format. The target
star in this case, TOI-7037, is 10th magnitude and is detected as a
double source in the 832nm filter. The bright central star in the
reconstructed image is the nominal science target while a fainter
companion lies to the North and slightly East at a separation of
0.37 arcseconds and position angle of 13.4 degrees. The relative
"delta-magnitude" of the pair is 2.87 at 832nm. It is noteworthy
that the image also shows a faint artifact in the opposite quadrant
from the true companion, at the same separation. Such artifacts
appear in many reconstructed speckle images and sometimes cause
ambiguity about which secondary source in the reconstructed image
represents the true orientation of a companion.
Contrast curves:
Contrast curves are a product of the speckle pipeline and
are represented as both PDF figures and a data table.
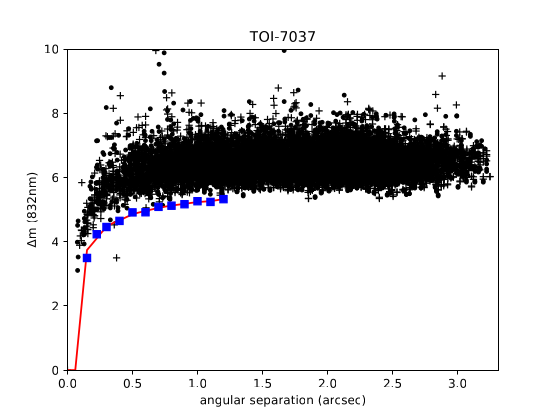
(Top figure) The contrast curve shows sensitivity to detecting point
sources around the target as a function of angular separation from
the target (star). To measure the background limit, a set of
concentric annuli are defined in the reconstructed image, centered
on the central star. The sky noise, defined by local minima and
maxima, is measured. These are plotted as dots and plus signs
respectively. The mean and standard deviation of the extrema in
each annulus are found and a background limit is defined as 5 sigma
brighter than the mean (with some outlier rejection of detected
stars and/or artifacts). The blue squares represent the limit in
each annulus and are connected by a smooth, fitted red line.
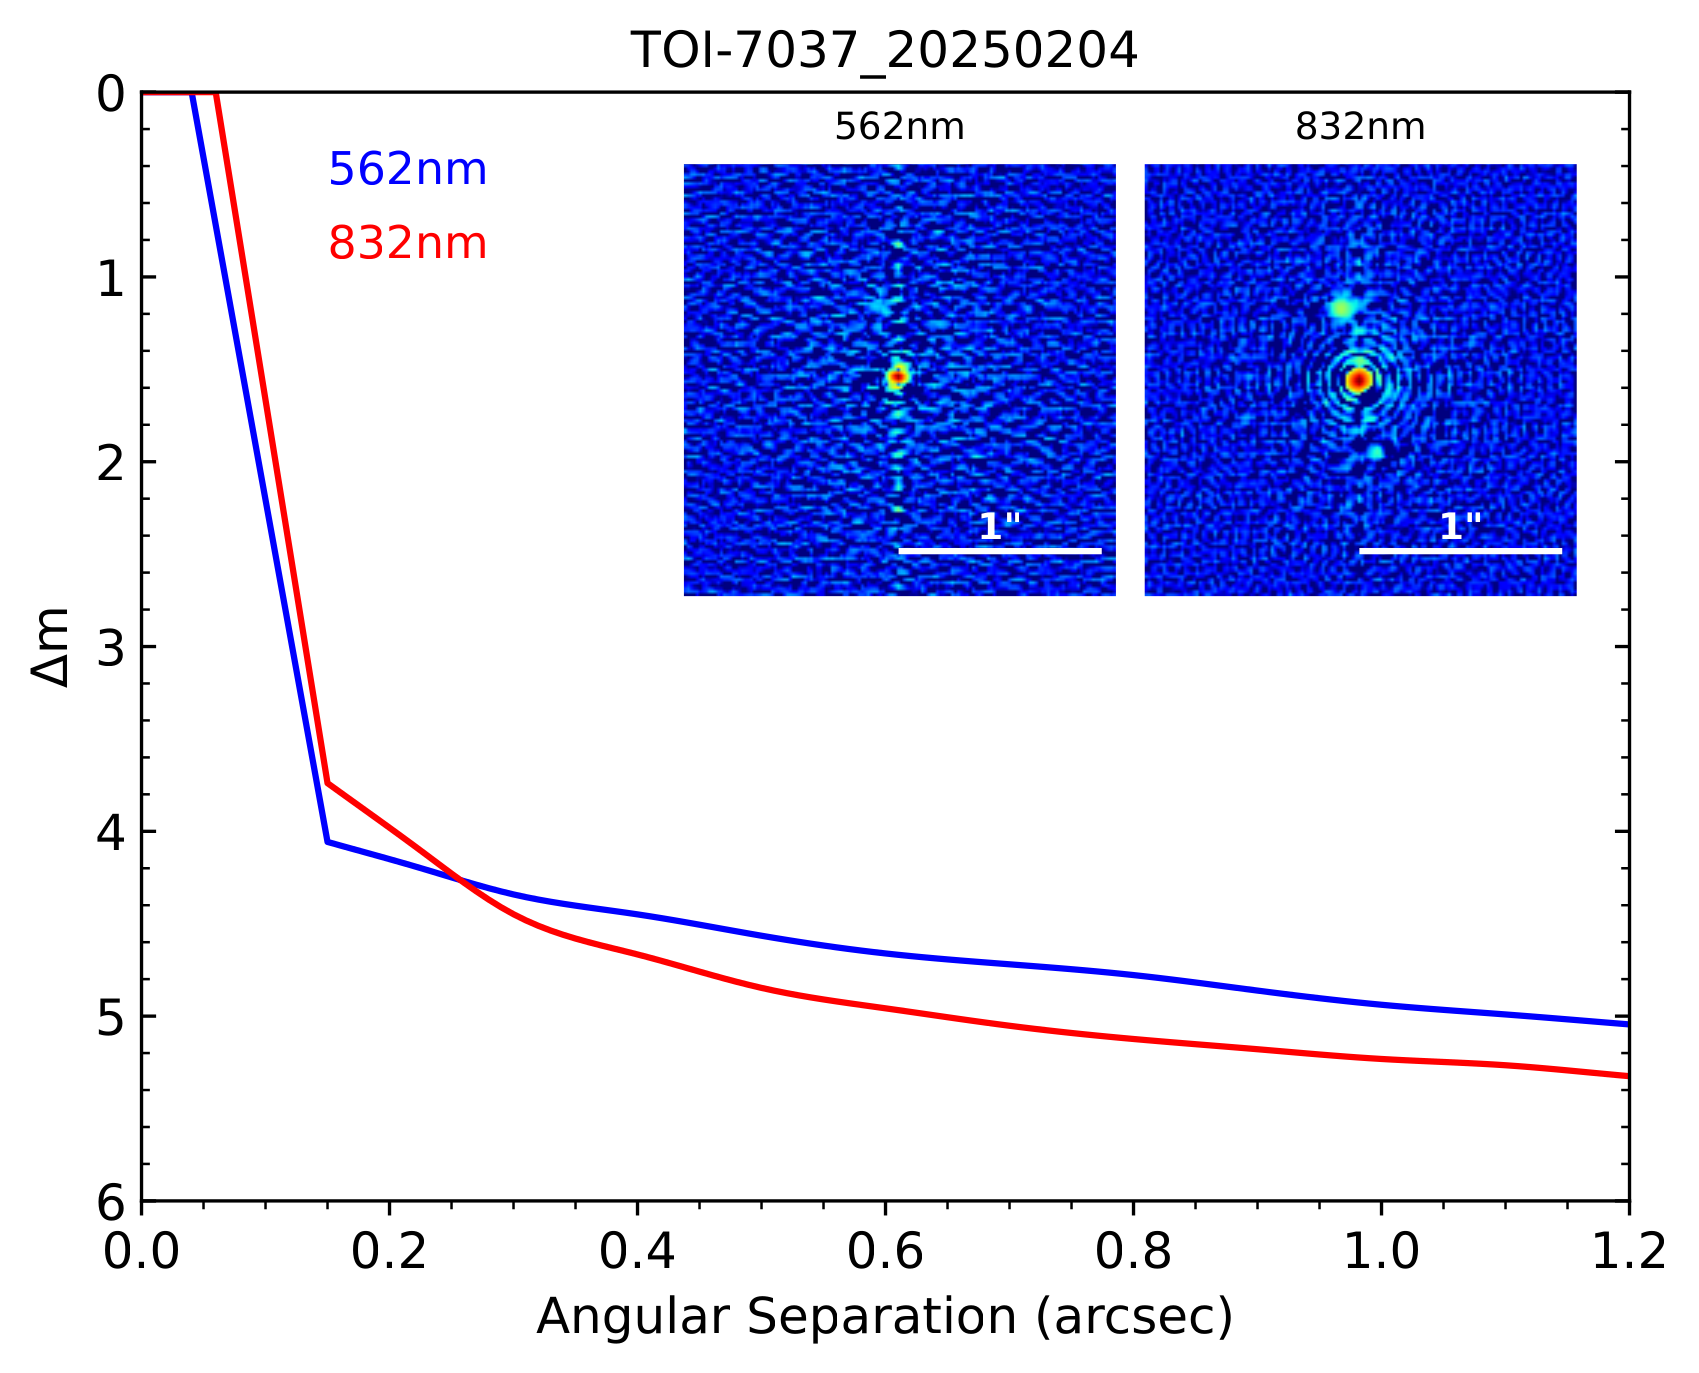
(Bottom figure) An alternative PDF of the same target's contrast
curve in two filters, combined with inset reconstructed images.
The contrast curve here is typical of relatively bright sources, rising sharply from zero at the telescope diffraction limit of 0.06 to 3.7 magnitudes near 0.15 seconds then increasing slowly out to 1.2 arcseconds, the outermost extent where we quote the contrast measurements.
The data table below corresponds to the background limit plotted above at 832nm. The first section of the table lists the inner, outer and middle radii of the concentric annuli used to measure background noise along with the resulting contrast magnitude. The second section of the table gives points along the fitted curve through these measurements.
# objectname: TOI-7037
# Telescope: WIYN
# Date of obs.: 2025-02-04
# camera: r
# wavelength: 832nm
# annulus range¢er vs. measured relative mag. limit:
0.100000 0.200000 0.150000 3.493280
0.200000 0.250000 0.225000 4.231772
0.250000 0.350000 0.300000 4.457893
0.350000 0.450000 0.400000 4.647570
0.450000 0.550000 0.500000 4.912463
0.550000 0.650000 0.600000 4.916884
0.650000 0.750000 0.700000 5.085410
0.750000 0.850000 0.800000 5.121175
0.850000 0.950000 0.900000 5.167624
0.950000 1.050000 1.000000 5.260599
1.050000 1.150000 1.100000 5.238952
1.150000 1.250000 1.200000 5.325119
# fit of angular separation vs. relative mag. limit:
0.000000 0.000000
0.010000 0.000000
0.020000 0.000000
0.030000 0.000000
0.040000 0.000000
0.050000 0.000000
0.059819 0.000000
0.060000 0.007497
0.070000 0.422155
0.080000 0.836813
0.090000 1.251471
0.100000 1.666129
0.110000 2.080787
0.120000 2.495445
0.130000 2.910103
0.140000 3.324761
0.150000 3.739419
0.150000 3.739419
0.160000 3.787831
0.170000 3.836024
0.180000 3.884146
0.190000 3.932340
0.200000 3.980751
0.210000 4.029524
0.220000 4.078804
0.230000 4.128718
0.240000 4.178985
0.250000 4.228916
0.260000 4.277804
0.270000 4.324942
0.280000 4.369622
0.290000 4.411138
0.300000 4.448782
0.310000 4.482058
0.320000 4.511306
0.330000 4.537078
0.340000 4.559923
0.350000 4.580392
0.360000 4.599036
0.370000 4.616406
0.380000 4.633051
0.390000 4.649524
0.400000 4.666374
0.410000 4.684023
0.420000 4.702374
0.430000 4.721201
0.440000 4.740278
0.450000 4.759380
0.460000 4.778280
0.470000 4.796753
0.480000 4.814572
0.490000 4.831511
0.500000 4.847345
0.510000 4.861910
0.520000 4.875295
0.530000 4.887649
0.540000 4.899123
0.550000 4.909867
0.560000 4.920032
0.570000 4.929769
0.580000 4.939227
0.590000 4.948557
0.600000 4.957910
0.610000 4.967403
0.620000 4.977018
0.630000 4.986703
0.640000 4.996410
0.650000 5.006085
0.660000 5.015679
0.670000 5.025140
0.680000 5.034418
0.690000 5.043462
0.700000 5.052220
0.710000 5.060653
0.720000 5.068764
0.730000 5.076569
0.740000 5.084081
0.750000 5.091316
0.760000 5.098288
0.770000 5.105013
0.780000 5.111504
0.790000 5.117777
0.800000 5.123846
0.810000 5.129729
0.820000 5.135454
0.830000 5.141051
0.840000 5.146552
0.850000 5.151987
0.860000 5.157387
0.870000 5.162783
0.880000 5.168206
0.890000 5.173687
0.900000 5.179256
0.910000 5.184929
0.920000 5.190665
0.930000 5.196405
0.940000 5.202094
0.950000 5.207674
0.960000 5.213088
0.970000 5.218279
0.980000 5.223190
0.990000 5.227764
1.000000 5.231944
1.010000 5.235699
1.020000 5.239104
1.030000 5.242260
1.040000 5.245270
1.050000 5.248233
1.060000 5.251252
1.070000 5.254427
1.080000 5.257860
1.090000 5.261653
1.100000 5.265905
1.110000 5.270689
1.120000 5.275951
1.130000 5.281605
1.140000 5.287569
1.150000 5.293757
1.160000 5.300086
1.170000 5.306470
1.180000 5.312827
1.190000 5.319072
1.200000 5.325119