wiyn header

S2KB CCD and Filter Info


Pixel Size: 21x21 microns
Pixel Scale: 0.60 arcsec/pixel
Chip Size: 2048 x 2048
Digital Limitation: 65,534
Bias Level: ~650 (gain=#4)
Preflash, e-: none
Dwell Time, microsec: 2 3 5 8 15
Noise, e-/RMS: ? ? 20 14-15 9-10
Gain, e-/ADU: 9.8 6.5 3.9 2.5 1.3
Gain, Index#: 1 2 3 4 5
Linearity,0.1%,e-: ~210,000
Linearity,1.0%,e-: ~230,000
Column Spillover, e-: ~240,000
Internal Radiation Event Rate, Events/HR: ~2700
Dewar Temp. deg C: ~-107
CCD Temp. deg C: ~-99
Dark Current, e-/hr/pix: ~5-10
Hot Columns: [1571:1571,1134:2048] bias
                     : [2066:2066,1:2048] in overscan region, see comment below
Low Columns: [1103:1103,744:2048] flat field

The quantum efficiency of S2KB is given in this figure. The abscissa is wavelength in nanometers and the ordinate is dQE (%).

Here are some of the original calibration frames for S2KB.

There is a hot column in the overscan region, [2066:2066,1:2048]. Check for the presence and position of this column in your data. You will probably NOT want to use the default BIASSEC in CCDPROC, but rather set BIASSEC to [2053:2064,1:2048] or a similar region of your choosing.

More recently, S2KB has developed an enhanced bias level in one corner amounting to a peak of ~1500 ADU above an overall level of ~965 ADU. This bias exposure shows this effect. The enhancement is limited to the region X < ~240 pix and Y> ~1800 pix.

You can estimate exposure times for S2KB using the CCDTIME package in IRAF v2.11.3 which should still have the necessary information in its ccdtime$kpno.dat database file. If it does not, here is the kpno.dat file.

Click here for the latest on scattered light and over-illuminiation.

Filters

Each filter is 4x4 inches square.

wiyn # cwl fwhm %T max name & comments age Data Tables Graph
y001 3645 556 60 U Harris Solid 03-2004 Full   Bandpass Graph
y002 4279 1070 70 B Harris 04-2003 Full Graph
y003 5399 936 86 V Harris 04-2003 Full Graph
y004 6404 1509 85 R Harris 04-2003 Full Graph
y005 8333 2077 93 I Harris 11-2001 Bandpass Graph
y006 6577 59 87 H-alpha 10-2007 Full   Bandpass Graph
y007 6618 60 86 H-alpha+4nm 10-2007 Full   Bandpass Graph
y008 6658 60 90 H-alpha+8nm 10-2007 Full   Bandpass Graph
y009 6700 63 90 H-alpha+12nm 10-2007 Full   Bandpass Graph
y010 6742 60 88 H-alpha+16nm 4-2008 Bandpass Graph
y011 3467 34 34 Stromgren u 01-2013 Full Graph (lab test)
y012 4117 133 64 Stromgren v 01-2013 Full Graph (lab test)
y013 4718 207.7 88 Stromgren b 01-2013 Full Graph (lab test)
y014 5514 227 85 Stromgren y 01-2013 Full Graph (lab test)
y015 4854 30 78 Hb-narrow 01-2013 Full Graph (lab test)
y016 4875 139 90 Hb-wide 01-2013 Full Graph (lab test)
y017 3972 96 53 Ca 01-2013 Full Graph (lab test)

The passbands of the most commonly used filters are collected (and shown graphically) in a single spreadsheet for convenience:

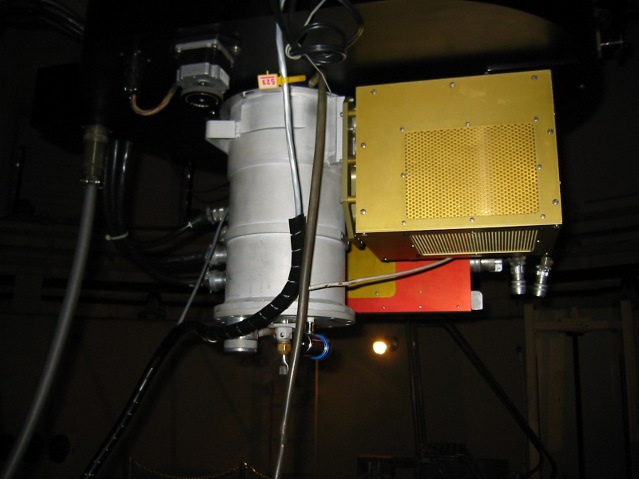
dewar

Observing Tools

Telescope Schedule

Telescope Calendar

Telescope Manual

ORP Form

S2KB CCD/Filter Info

Mosaic Info

Queue Observing

Remote Observing

Night Log

Observing Run Evaluation

KPNO Service

Weather Links


Contact

Heidi Schweiker
WIYN 0.9m Observatory
950 N. Cherry Ave.
Tucson, AZ 85719
E-mail: heidi.schweiker@noirlab.edu
Telephone: (520) 318-8140
wiyn footer
Anthony Petrie's index page Josh Schwartz's index page