The following is a guide to the capabilities of speckle imaging at WIYN and to preparing a speckle observing program using NESSI. Speckle observations using NESSI at WIYN are currently carried out in queue mode, which operates during 1-2 months per semester and is applied for through the NN-Explore program at NFS's OIR Lab or university partners' proposal processes. Speckle queue PI's receive a set of reduced data products in the month or so following the observations. For questions not answered here (or if this document is unclear), contact the support scientist,
Speckle imaging using the NN-Explore Exoplanet Stellar Speckle Imager (NESSI) at WIYN provides observers with diffraction-limited resolutions within small (few arcsec wide) fields. The two electron multiplying CCDs (EMCCDs) of NESSI operate simultaneously through a pair of filters (out of a current choice of 4 specialized speckle filters or sometimes its SDSS filters). A common use of speckle imaging has been to detect and provide relative photometry and astrometry for binary and higher-order multiple stars. The relative astrometry, brightnesses and colors from NESSI data help characterize the components and may be used to measure visual binary orbits or relative proper motions. At WIYN, speckle imaging should reach sensitivities to detect companions at least 3-5 magnitudes fainter than a target star depending on brightness, exposure time and conditions. Typically, the time spent integrating on a speckle target is 1-8 minutes.
A standard speckle observing method and data reduction pipeline (Howell et al. 2011) has been developed over the years at WIYN and other telescopes using NESSI's predecessor instrument, DSSI. This procedure results in the type of data needed by the current data reduction pipeline. Once a target a been acquired, data are taken by reading a subsection of the full array (for NESSI this window is 256x256 pixels or 4.6x4.6 arcsec). Normally, the readout region is centered on the target of interest. Images are taken in sets of 1000 frames apiece where each frame is a 40 millisecond exposure (and each image set requires a little over 40 seconds to complete (overhead is very small within the sequence of frames). To achieve deeper imaging or for faint targets and poor conditions, multiple image sets are taken. Multiple sets may also be taken to mitigate risks of ending up with adverse data quality on bright targets.
In addition to science targets, at least one bright point source star in close proximity on the sky is observed using the same techniques. This point source standard accounts for the shifting PSF as a function of mount coordinates, airmass and focus. During queue observing, the same point source may be applied to multiple science targets that are close together on the sky and may be shared among multiple programs who are using the same filters. A few binary stars with quality astrometric fits are observed each queue run and these are used to check on, and apply small corrections to, the nominal plate scale and field rotation for the astrometric fits to data resulting from that run.
The NESSI queue sequence of observations is not currently scheduled in an automated way. Instead, targets are drawn from a list of availability (generally an RA-ordered list for each night) at the observer's discretion. Targets identified by PI's as higher priority within their programs are given priority. Observing time for each program is tracked with the goal of ending up having comparable percentages of time allocated to each program used up by the end of the semester. This flexible approach allows the queue observations to operate in conditions of unpredictable clouds, seeing variations, high winds and observatory overhead time. Historically, programs with relatively bright targets will tend to reach a higher level of completion because such targets may be observed through thin clouds or average seeing while still achieving good data quality.
Data reduction is done using a custom software pipeline run by the speckle team. Users of the speckle queue will receive 4 basic pipeline products for each target in each filter. The products were developed as part of projects to detect previously-unresolved secondary stars or fore- or background sources near stars of interest and to acquire temporal astrometric measurements for measuring binary star orbits. These data products are probably applicable to a wider variety of programs:
See example data products here.
Users can ask for the raw data, although this will often be quite large (~100GB/night) and hasn't been requested by most users. The raw data is stored at NOIRLab, but is not kept online or rapidly accessible.
The effectiveness of speckle imaging is strongly dependent on observing conditions, especially seeing. As a rough guide, NESSI should be able to operate effectively on stars of V or R magnitude as faint as 13.5 under reasonably good conditions. In excellent conditions, stars of V=14 are observable. Fainter (in V or R) red stars like M dwarfs may be observable in the red channel using filters such as z or at 832nm.
Note that the magnitudes above refer to a "central" target star, around which fainter companions may be detected. Faint companions may be detected down to a background limit, which depends on the seeing and typically rises in its magnitude difference relative to the central star with increasing angular separation. A contrast curve reaching 5 magnitudes fainter than the central star is achievable for stars brighter than V=12. For fainter stars, longer integrations are used. Even so, the resulting images are typically less deep.
The field-of-view for speckle imaging is limited by the angular size of the atmosphere's isoplanatic patch. Speckle patterns of stars separated by more than ~1 arcsec become uncorrelated, lowering the sensitivity to detect and measure their relative properties. For this reason, NESSI is normally operated using a 256x256 pixel readout region and the data reduction pipeline further restricts the field-of-view over which contrast curve measurements are made (out to 1.2 arcsec in separation). Detections may be made outside of this region, but they are less sensitive with relative magnitudes of companions becoming systematically overestimated. The size of the isoplanatic patch shrinks with poorer seeing and experiements have shown that the product of seeing and the angular separation from the target (in arcsec^2) should be less than 0.6 to ensure the photometric data is unaffected by this effect. Poor seeing should not affect the astrometry.
Speckle interferometry delivers imaging at or near the telescope diffraction limit. The diffraction limit in each speckle filter is listed in the table below. Note, however, that these numbers are not necessarily indicative of the filter choices that will yield the best-resolved images! Our ability to construct speckle images with small inner working angles, push for relatively deep background limits inside of a few tenths of arcseconds, and resolve (for example) close binaries, depends on closely matching the PSF of science targets to point source standards. Generally, the worse seeing and greater differential atmospheric diffraction at shorter wavelengths renders speckle in the bluer filters more difficult and the image quality may be adversely affected. For these reasons, the red filters often yield effectively superior angular resolution and deeper detection limits. For similar reasons, targets that can be observed at low airmass at WIYN will work best. There are no ADC optics in use with NESSI.
The performance of speckle imaging is quite sensitive to conditions like seeing, so there are no strict rules to follow for determining the ideal number of image sets to acquire on a target of given brightness. At this time the recommendation is to acquire no fewer than 2 image sets per target because this mitigates the risk of ending up with a poor quality image set, which can happen sporadically. Other reasons for the recommendation are noted below.
Observers targeting stars fainter than V=13 should plan on acquiring multiple image sets and those observing brighter stars will usually benefit from taking multiple sets. The number will depend on how they balance better contrast depth/image quality vs. number of targets visited. Multiple image sets per star can also help under less than optimal observing conditions and, given the several minutes needed to set up observing of each new target, many users may want to devote comparable time to exposures.
Each image set requires 40 seconds of telescope time with a few seconds between sets. Acquiring a target with a short slew requires 2 minutes and with a long slew, about 3 minutes. Since a science target requires a point source observation, additional time is needed for that (about 3 minutes). Refer to the guide on estimating observing time for more information.
Note that we have found the signal-to-noise ratio for detecting secondary sources in speckle images does not grow as rapidly with exposure time as it would in traditional CCD imaging (ie. with the square root of time). Proposers may not expect to achieve the same contrast limits on faint stars as bright ones (5 magnitudes may be achievable on 12th magnitude stars and 3 magnitudes on 14th magnitude stars.) The table below only suggests numbers of image sets to take for various magnitude stars:
| V or R | # image sets |
|---|---|
| <12 | 2-3 |
| 12-12.5 | 3 |
| 12.5-13 | 5 |
| 13-13.5 | 7 |
| >13.5 | 9 |
To prepare an observing proposal, you should estimate the time needed to carry out the observations. Use the guide to estimating observing time (PDF) for help with that.
If you're unsure how to estimate your observing time or the guide
doesn't seem to apply to your project, contact the support scientist
for help.
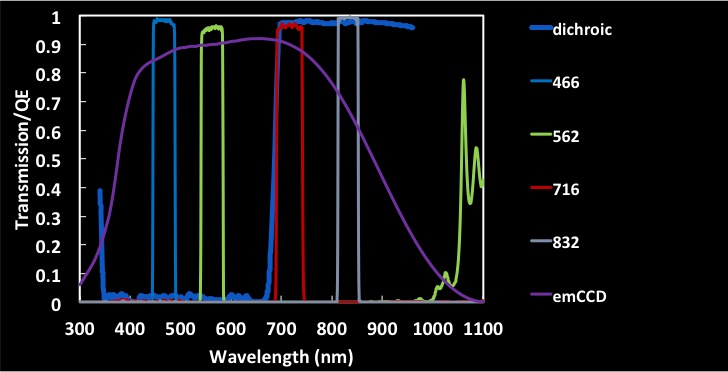
NESSI uses a dichroic beamsplitter to separate the incoming light (at 686nm) into blue and red channels before focusing on the two identical cameras, which operate simultaneously. The speckle filter choice will be one of 467nm or 562nm paired with one of 716nm or 832nm. NESSI's SDSS filters are also listed below. They may be used for speckle imaging, as discussed below and, in this case, users' filter choice will include SDSS ugr in the blue channel and iz in the red. Transmission curves linked from the filters table are as quoted by the manufacturer.
The narrower speckle filters of 40-50 nm bandpass width help to limit the effects of wavelength-dependent speckle patterns and the elongation of the speckles at a position angle along the parallactic angle due to differential atmospheric refraction (and successfully matching those effects in the calibration stars taken in conjunction with science targets). The advantage offered by the SDSS filters is that their bandpasses are 3-5 times as wide and will push NESSI's limits on target magnitudes deeper by an additional magnitude or more. For faint targets, and perhaps for the reddest stars with fluxes rising rapidly at wavelengths longer than 800nm, observing with SDSS filters (especially z for red stars) is often beneficial. The drawback will be deteriorating spatial resolution and very likely there will be more problems encountered in getting quality data reduction on targets that were observed at high airmass (>1.5).
| Name | c. wave | FWHM | diffraction limit | data |
|---|---|---|---|---|
| (nm) | (nm) | (arcsec FWHM) | ||
| 467 | 467.1 | 44.0 | 0.034 | nessi_467.dat |
| 562 | 562.3 | 43.6 | 0.040 | nessi_562.dat |
| 716 | 716.0 | 51.5 | 0.051 | nessi_716.dat |
| 832 | 832.0 | 40.4 | 0.060 | nessi_832.dat |
| u | 354.3 | 32.7 | nessi_u.dat | |
| g | 480.0 | 151.1 | nessi_g.dat | |
| r | 620.0 | 143.5 | nessi_r.dat | |
| i | 765.4 | 146.4 | nessi_i.dat | |
| z | 943.3 | 242.7 | nessi_z.dat |
Other important efficiency curves:
QE of NESSI's Andor Ixon 888 "BV" EMCCDs
Andor's BB-VS-NR (wedged) dewar window transmission
Semrock Di03-R660 dichroic transmission/reflection (used for all NESSI data starting 2017 May 10)
older dichroic transmission/reflection (used for all NESSI data before 2017 May 10)
In addition to the usual information included in observing proposals, proposers to the speckle queue must submit a coordinate list sufficient to carry out the program. The coordinate list can be altered and resubmitted close to the observing date if the nature of the program warrants it. In some cases, where target lists have been submitted with your proposal, we may take those coordinates as a starting point and check with PIs to make sure they are finalized and whether there are special instructions. The speckle coordinate lists are not submitted to the Kitt Peak Coordinate Cache system (which the speckle program does not use), but rather are plain text format files which can be emailed to the support scientist, Mark Everett.
In addition to science targets, point source standards will need to be observed. It is likely easiest for the speckle queue team to pick good point sources for you, which we will do if you don't provide them. In any case, an estimate for the time required to carry out your observing program should include the time needed to observe the point source standards. The best point source standards are HR stars of 5-6th V magnitude within 5 degrees of each science target, and which are thought to be single. For efficient slewing, the science target and its associated point source should both lie either north or south of 31.96 degrees declination, the zenith at WIYN.
During a typical night, nearby science targets from different queue proposals will be observed sequentially and may share a single point source standard observation for their calibration.
Your coordinate list should be provided at least a week prior to the observing run or by a due date announced to all queue users by the support scientist. You may also be contacted to ensure that we have any other additional instructions to carry out your program.
A proper coordinate list should include a target name, RA & DEC (equinox J2000 please!), an optical magnitude measurement or estimate in a specific filter and any significant proper motions in RA and DEC. If you provide proper motions, please also make it very clear which epoch is used for basing the proper motions and ideally have the proper motions of all of your targets be based on that epoch. Note that with the small speckle field-of-view, it is important for us to correctly identify your targets! To that end, it can be helpful if the target name is identifiable to the observer using SIMBAD or other online sources of information such as Exofop. In certain crowded fields, finding charts could be helpful. Proper motions are needed only if they are rather large (e.g., target moved more than a few arcsec since 2000). If you group your targets into priority bins or provide a priority order or ranking, or special instructions for different targets, it would be helpful if you indicate these things on each row of your coordinates list.
Below is an example coordinate list of 3 objects listing RA, DEC, Vmag, pmRA and pmDEC in milliarcsec/year respectively (if you use a comparable format, e.g., hexidecimal coordinates, it will be helpful). An attempt will be made to produce data products with filenames derived from the target names you provide (whitespace and certain special characters may need to be stripped out). CSV formats are also fine. Having column labels will be helpful.
    #Equinox J2000, proper motions are for epoch J2000
    #P1 = highest priority, P2 = lower priority
    #ID              RA          Dec         VMag pmRA   pmDec  priority
    HIP_1	     00:00:00.21 +01:05:20.4 9.08 -0.360 -5.053   P1
    HIP_40617        08:17:31.65 +08:51:58.7 6.26 -14.2  -8.17    P2
    BD+71_889A       18:20:45.43 +71:20:16.1 4.22 -5.03  37.86    P2
A description of our data products may be found in Howell et al. (2011) and Scott et al. (2018). Scott et al. (2018) describes NESSI.
Howell et al. 2011, AJ, 142, 19
Scott et al. 2018, PASP, 130, 4502
A request for acknowledgement is made of authors using NESSI data in publications.