
- About WIYN
- Observing at WIYN
Available Instruments
Optical Imaging
Infrared Imaging
Spectroscopy
Observing Tools
Observing Planning
At the Telescope
After Your Run
- Internal Use
WIYN Oversight
Calendars
BENCH SPECTROGRAPH
Bench CCD (STA1) Characteristics
All of the data used in the analysis shown below were taken with the CCD operating at 152 K.
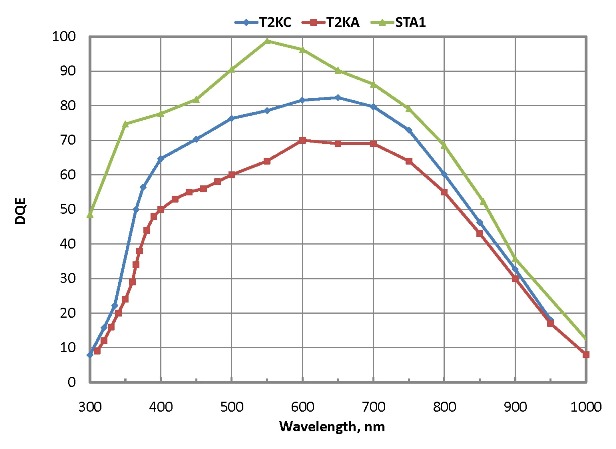
The Quantum Efficiency curves of STA1, T2KA and T2KC are shown above for comparison. The STA1 data come from UA-ITL. 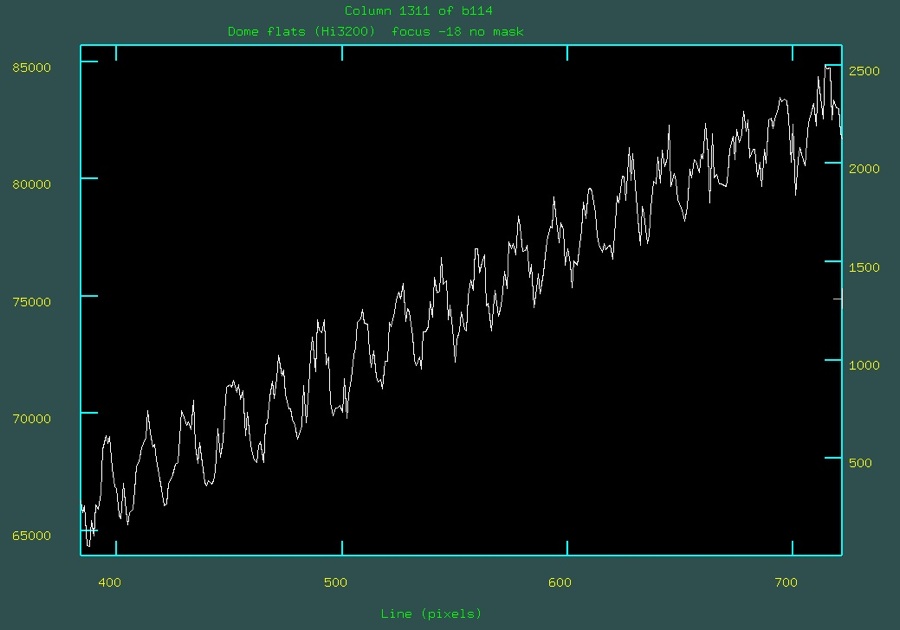
A column plot in the dispersion direction showing on-chip interference fringing starting near 7500 Å. 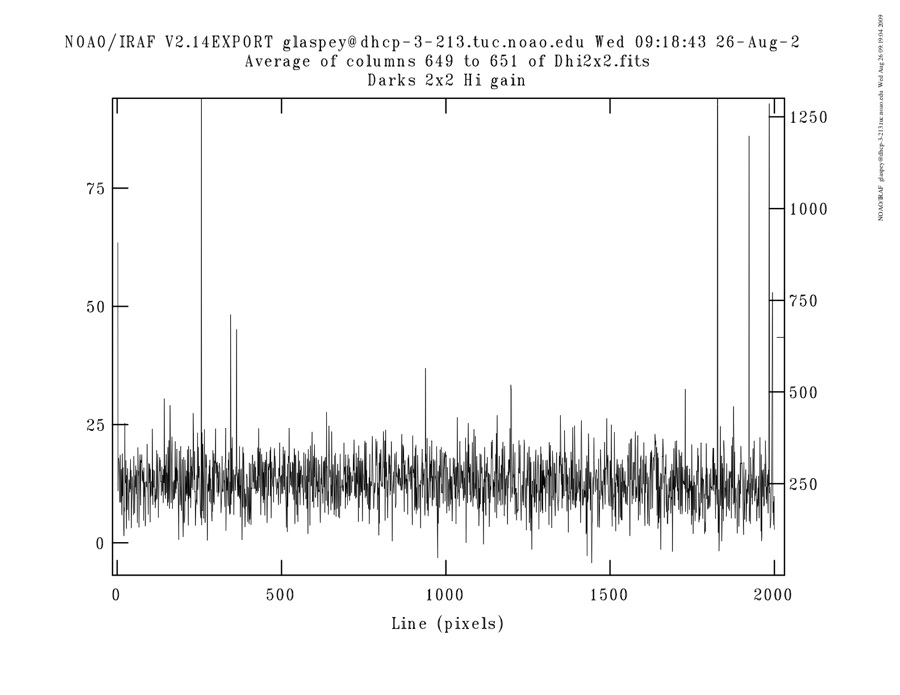
The plot above shows the dark current (expressed as ADU) averaged over 3 columns for a 1800 second dark. The binning was 2x2. 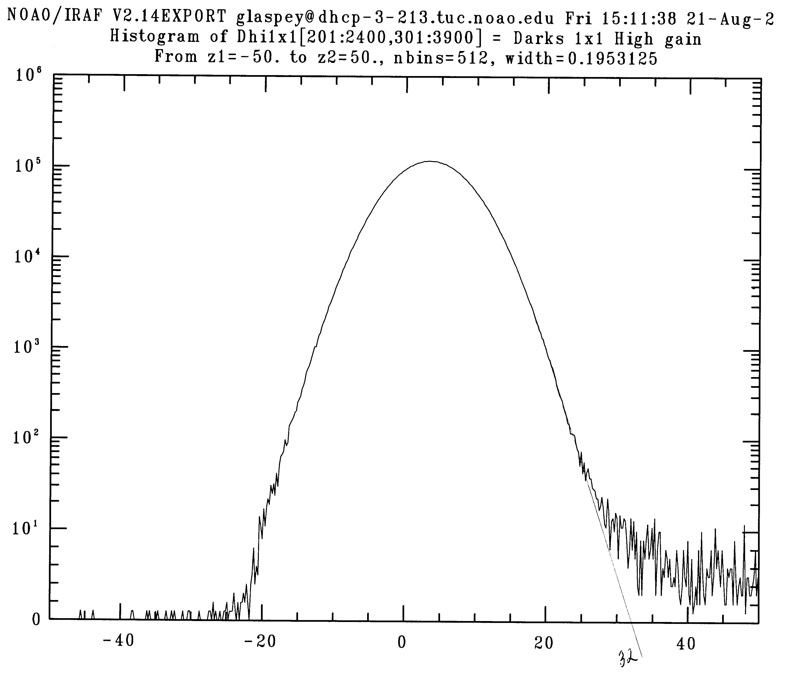
The histogram above shows the numbers of pixels as a function of dark counts (ADUs) for an 1800 second dark with no binning to highlight the hot pixels. The hand drawn line is meant to approximate the distribution of normal pixels. All of the pixels above the x-intercept can be considered as hot pixels. For 1x1 binning the percentage of hot pixels is 0.03%. 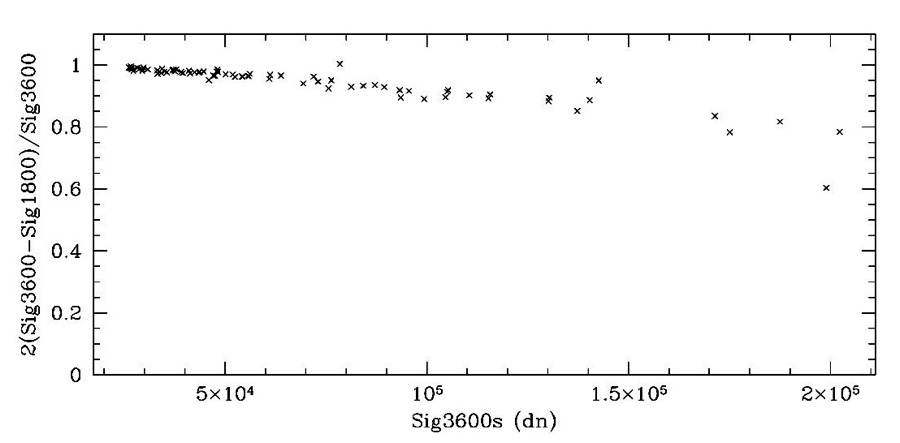
The plot above shows that the "hottest" of the hot pixels probably saturate, meaning that for a small fraction of hot pixels, dividing a 3600 sec dark by 2 to represent an 1800 sec dark gives too low a level for a few score pixels. Optimal extraction should minimize this effect on science data. 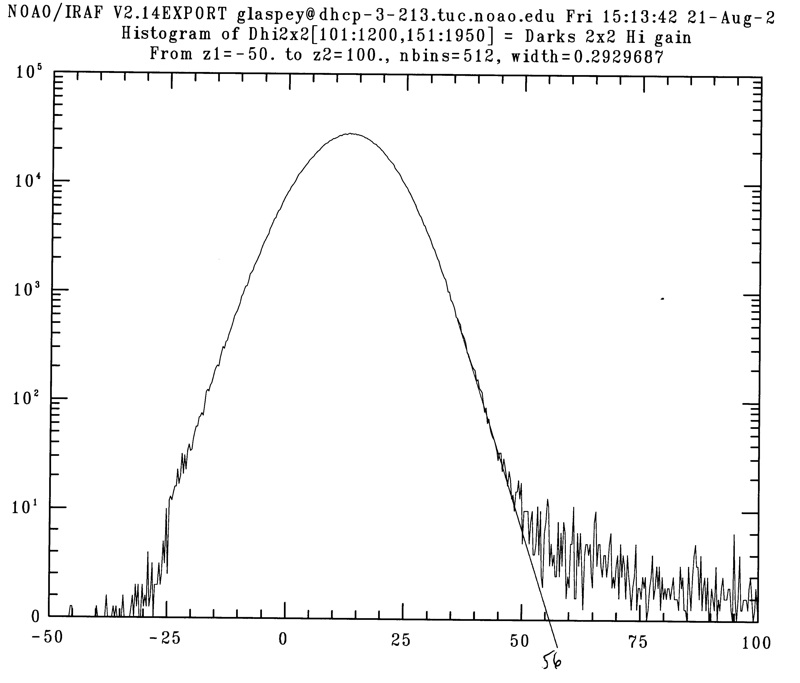
The histogram above shows how we estimated the fraction of hot pixels for 2x2 binning. The fraction is 0.10%. 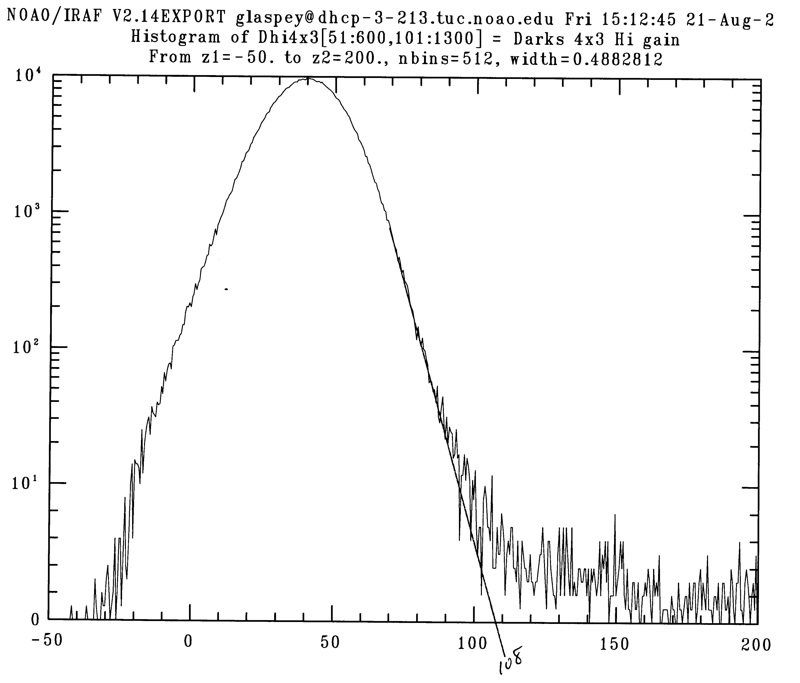
The histogram above shows how we estimated the fraction of hot pixels for 4x3 binning. The fraction is 0.25%. 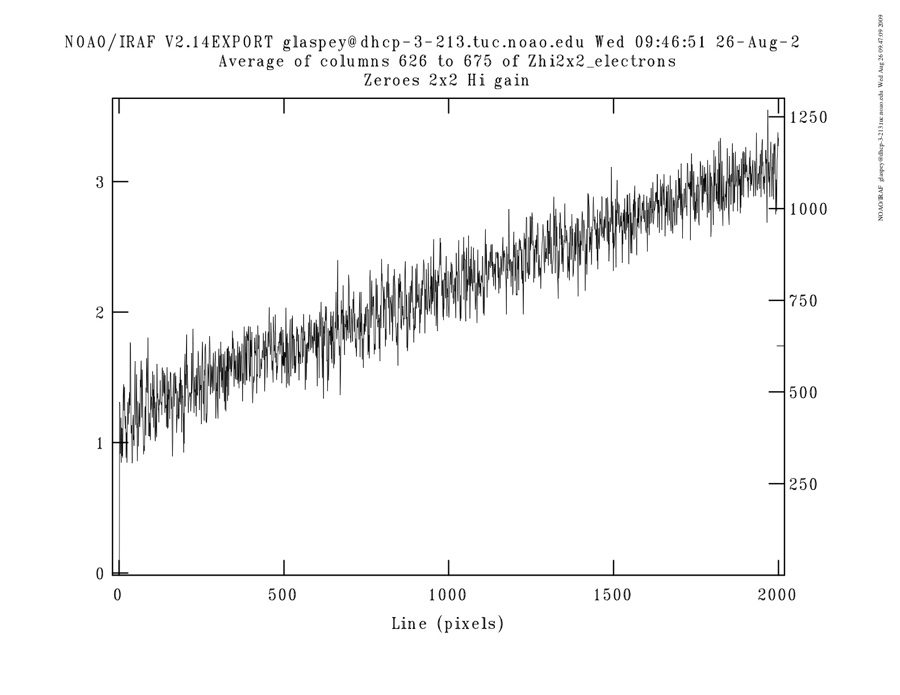
The column plot above shows the "injected charge" apparent in a mean bias image (Zero). The vertical scale is electrons. Whlle this ramp-like effect is removed by subtracting the Zero image during processing, the noise introduced is shown below. 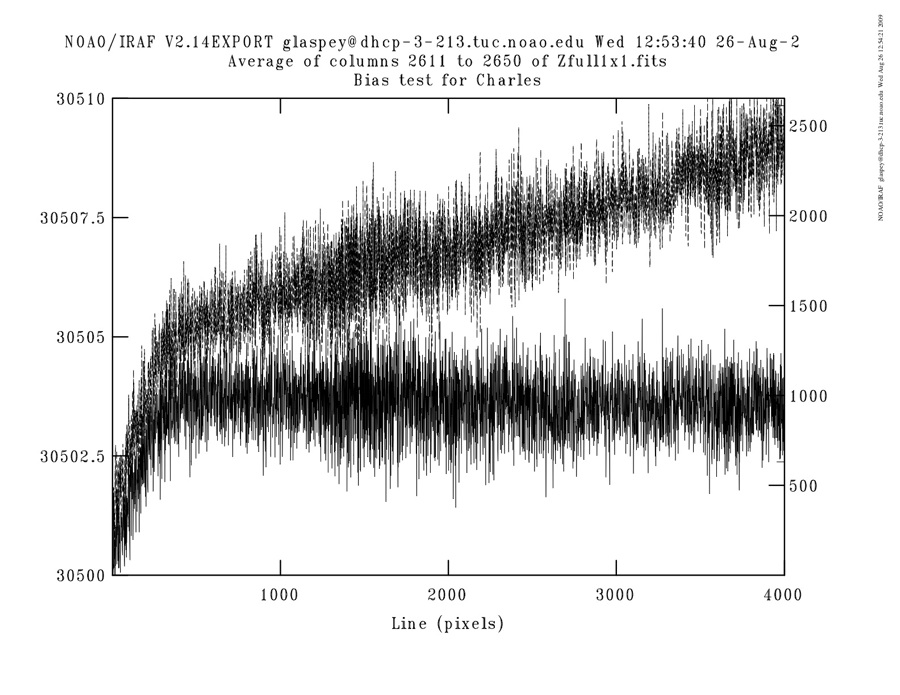
This plot shows the average of 40 columns in the image region (upper curve) compared to the average of 40 columns in the overscan region, demonstrating the injected charge relative to the base bias level. 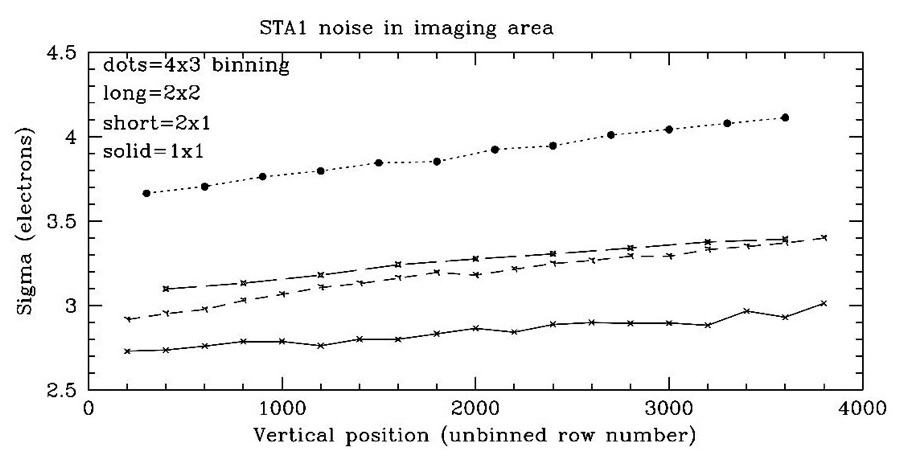
This plot shows the rms noise in the imaging area of several overscan-corrected mean bias frames, as a function of row number. The effective read noise changes with binning factor and position on the device due to the noise contribution of the "injected charge" present. 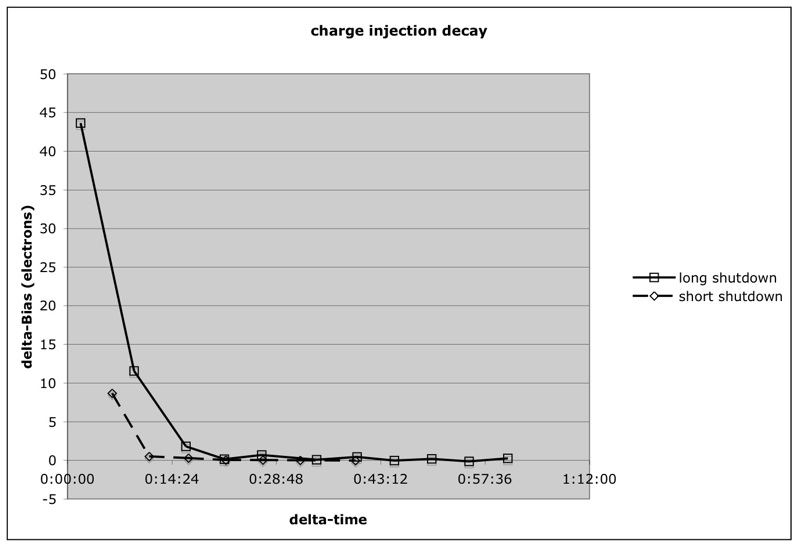
This shows the decay of the bias level with time when the CCD has just been powered on after having been powered off for long and short time intervals. It is advisable to run a series of bias frames immediately after powering the device on to help speed up the decay. Serious data taking can resume after about a 30 minute wait. 


wiyn-contact@noirlab.edu WIYN Observatory 950 N. Cherry Ave, Tucson, AZ 85719 

Last modified: 03-Apr-2020 16:10:59 MST
- Observing at WIYN