
- About WIYN
- Observing at WIYN
Available Instruments
Optical Imaging
Infrared Imaging
Spectroscopy
Observing Tools
Observing Planning
At the Telescope
After Your Run
- Internal Use
WIYN Oversight
Calendars
Bench CCD Characteristics
Device Characteristics for STA1 compared to T2KA
Property STA1 T2KA Size (pixels) 2600 x 4000 2048 x 2048 Pixel size 12 microns 24 microns Full Well 87500 electrons ?? Read Noise (overscan) - High Gain 3.2 el 6 el - Medium Gain 3.7 el - Low Gain 4.3 el Readout Times Binned 1x1; 2x2 - High Gain 227 sec; 67 sec - Medium Gain 140 sec; 45 sec - Low Gain 97 sec; 34 sec Conversion Gain - High Gain 0.219 (el/DN) - Medium Gain 0.438 (el/DN) - Low Gain 0.876 (el/DN) Dynamic Range (saturation/RN) (1x1) 17,000 (Gain=.22 e/DN) ?? Linearity 1% to 63,000 el 1% to 190,000 el
0.1% to 180,000 elUsable Data Range DN upper limit 1% linearity; Full well - High Gain 262,143 DN ; 262,143 DN - Medium Gain 143,800 DN ; 200,000 DN - Low Gain 72,000 DN ; 100,000 DN Dark Current for binning: above background level at 152 K - 2x1 1.40 el/2x1binned pix/half-hour - 2x2 2.64 el/2x2binned pix/half-hour 4-5 el/pix/hour - 4x2 4.88 el/2x1binned pix/half-hour Comments: - Users should note the numbers in the"usable" range - at medium or low gains it is possible to saturate the output amplifier before hitting the maximum values allowed by the Analog-to-Digital Converter. When the amplifier saturates the data become terribly non-linear.
- Although the dark current is very low, there are some "hot pixels" (for which dark current is much larger than their immediate neighbors) which can be corrected during the processing stage. We will be developing master dark frames based on large number of frames which can be scaled to reduced the affect of the hot pixels on the science data. The hot pixels were checked and seem to behave as linear as other pixels over signal levels corresponding to the range 4700 electrons to 74000 electrons.
- N.B. Be sure to leave the system running with the MOP gui visible at all times. When the one exits the MOP the clocks and control electronics are turned off. When the system is restarted after being powered down for any length of time, a residual charge remains on the CCD that looks like a weak signal. It takes several minutes in the powered on but idle state to clear this charge.
- Fringing: there is fringing with this device longward of 7000 Å. A sample is reproduced below.
Measured Quantum Efficiency for STA1 T2KA and T2KC
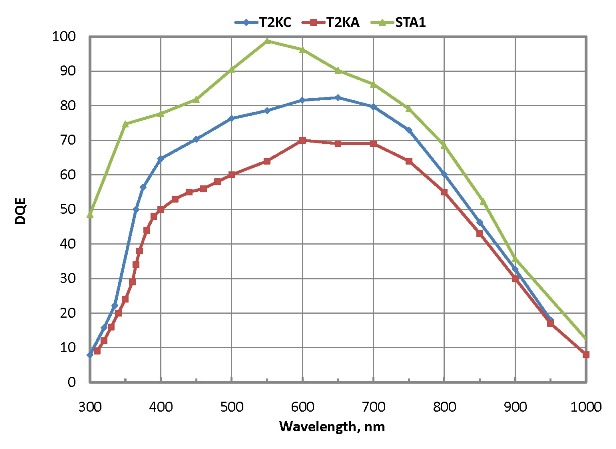
Expected spectral performance
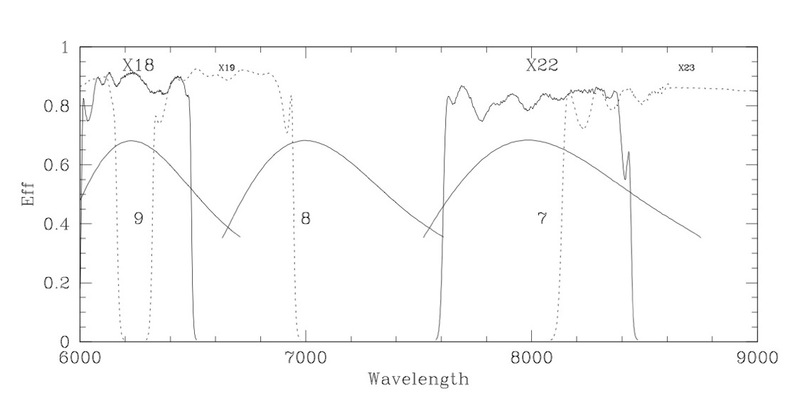
BSC (f=285mm) T2KA STA1 24 micron pixels 12 micron pixels Grating l/mm Blaze angle Order Blaze &lambda Linear disp Dispersion Coverage Dispersion Coverage Angs Angs/mm Ang/pix Angs Ang/pix Angs 316@7 316 7 1 7677 110.21 2.645 5417.0 1.323 5290.1 316 7 2 3725 55.10 1.323 2708.5 0.661 2645.0 400@4.2 400 4.2 1 3537 87.48 2.100 4300.0 1.050 4199.2 600@10.1 600 10.1 1 5646 57.57 1.382 2829.8 0.691 2763.5 600@13.9 600 13.9 1 7734 56.77 1.362 2790.2 0.681 2724.8 600 13.9 2 3867 28.38 0.681 1395.1 0.341 1362.4 860@30.9 860 30.9 1 11535 35.01 0.840 1720.8 0.420 1680.5 860 30.9 2 5767 17.50 0.420 860.4 0.210 840.2 860 30.9 3 3845 11.67 0.280 573.6 0.140 560.2 1200@28.7 1200 28.7 1 7730 25.65 0.616 1260.7 0.308 1231.1 1200 28.7 2 3865 12.82 0.308 630.3 0.154 615.6 316@63.4 316 63.4 6 9388 8.29 0.199 407.4 0.099 397.8 316 63.4 7 8047 7.10 0.170 349.2 0.085 341.0 316 63.4 8 7041 6.22 0.149 305.5 0.075 298.4 316 63.4 9 6259 5.53 0.133 271.6 0.066 265.2 316 63.4 10 5633 4.97 0.119 244.4 0.060 238.7 316 63.4 11 5120 4.52 0.108 222.2 0.054 217.0 316 63.4 12 4694 4.14 0.099 203.7 0.050 198.9 316 63.4 13 4333 3.83 0.092 188.0 0.046 183.6 316 63.4 14 4023 3.55 0.085 174.6 0.043 170.5 VPH740 740 19.0 1 8798 44.8 1.076 2203 0.538 2152 VPH740 740 19.0 2 4399 22.4 0.538 1101.8 0.269 1076 VPH3300 3300 57.6 1 5120 5.69 0.137 279.7 0.068 273.1 N.B. the dispersion and the coverage of the VPH gratings depends on the exact angle at which they are used. Simmons Camera (f=381mm - fewer fibers: see note below) 316@7 316 7 1 7450 82.44 1.979 4052.1 0.989 3957.1 316 7 2 3725 41.22 0.989 2026.1 0.495 1978.6 400@4.2 400 4.2 1 3537 65.44 1.571 3216.5 0.785 3141.1 600@10.1 600 10.1 1 5646 43.07 1.034 2116.8 0.517 2067.2 600@13.9 600 13.9 1 7734 42.46 1.019 2087.2 0.510 2038.3 600 13.9 2 3867 21.23 0.510 1043.6 0.255 1019.1 860@30.9 860 30.9 1 11535 26.19 0.629 1287.2 0.314 1257.0 860 30.9 2 5768 13.09 0.314 643.6 0.157 628.5 860 30.9 3 3845 8.73 0.210 429.1 0.105 419.0 1200@28.7 1200 28.7 1 7730 19.19 0.460 943.0 0.230 920.9 1200 28.7 2 3865 9.59 0.230 471.5 0.115 460.5 316@63.4 316 63.4 6 9371 6.20 0.149 304.7 0.074 297.6 316 63.4 7 8032 5.31 0.128 261.2 0.064 255.1 316 63.4 8 7028 4.65 0.112 228.5 0.056 223.2 316 63.4 9 6247 4.13 0.099 203.1 0.050 198.4 316 63.4 10 5623 3.72 0.089 182.8 0.045 178.5 316 63.4 11 5111 3.38 0.081 166.2 0.041 162.3 316 63.4 12 4686 3.10 0.074 152.4 0.037 148.8 316 63.4 13 4325 2.86 0.069 140.6 0.034 137.3 316 63.4 14 4016 2.66 0.064 130.6 0.032 127.5 VPH740 740 19.0 1 8798 33.5 0.805 1648 0.402 1610 " 740 19.0 2 4399 16.8 0.402 824 0.201 805 VPH3300 3300 57.6 1 5120 4.26 0.102 209 0.051 204 N.B. the dispersion and the coverage of the VPH gratings depends on the exact angle at which they are used. For comparison, two simple plots of approximate relative responses of the 316@63.4 echelle grating are shown below. Overlaid are the transmission curves of appropriate orders sorting filters to indicate the possible wavelength coverages. [N.B. There are also several order sorting filters for bluer wavelengths. Consult the Hydra Manual for more information.]
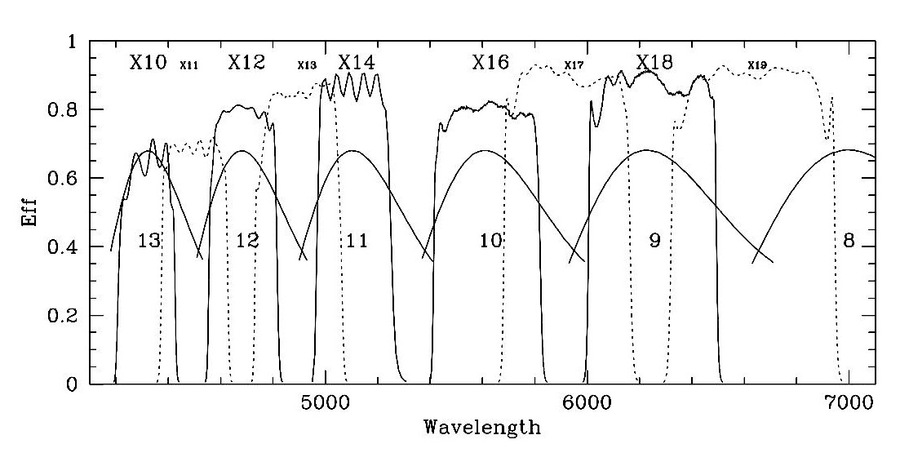
For fainter targets where spectral resolving power is less critical, the 3300 VPH grating may be more efficient than the Echelle. Please consult the VPH grating information page for details.
The plot below is a sample of fringing for STA1 at around 7500 Å. Data from a single column of a quartz lamp flatfield exposure. (Overscan level subtracted.)
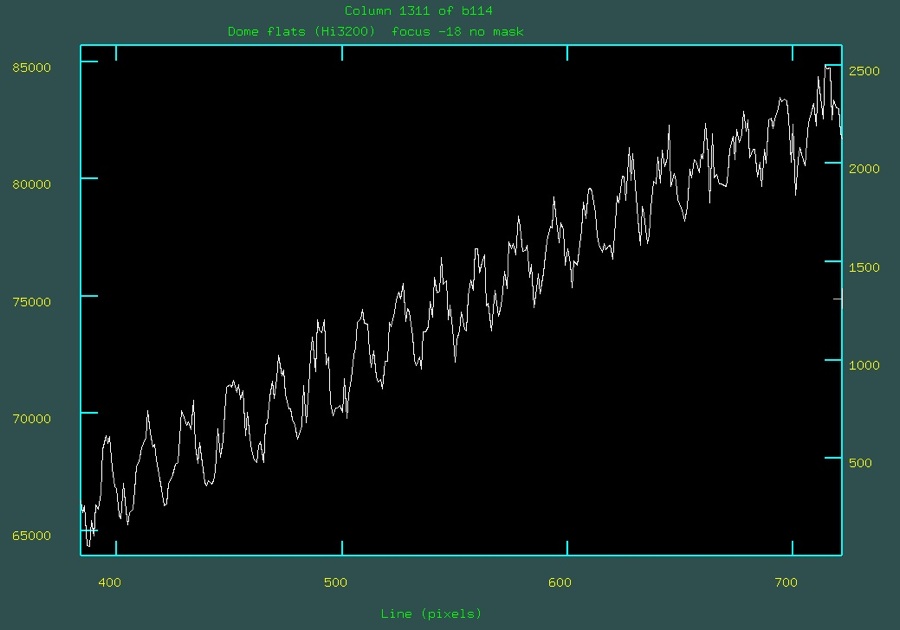
Observers working longward of 7000 Å should remember to take several flatfield images each time the configuration is changed.
Finally, because the STA1 CCD only has 2600 pixels of 12 microns each in the spatial direction, observers wishing to use the Simmons Camera instead of the BSC should be advised that apporximately 15 fibers corresponding to the top and bottom of the fiber foot are not imaged onto the CCD. Since there are also several broken fibers, there will only be a total of 66 usable fibers per configuration.
Two technical reports describing characteristics of the device and its performance while being characterized are available:
- Detector Characterization Report from the University of Arizona Imaging Technology Laboratory, and
- CCD Test Report from the NOAO MONSOON Group. [Note that the device is currently being run with a single (Right amp) amplifier readout.]


wiyn-contact@noirlab.edu WIYN Observatory 950 N. Cherry Ave, Tucson, AZ 85719 

Last modified: 03-Apr-2020 16:06:14 MST
- Observing at WIYN